

What we append to your design
Before expression, we add a two-part tag to your submitted sequence, joined by flexible GGGS linkers. Default placement is the C-terminus.- split-GFP11, for expression quantification.
- Twin-Strep-tag, for purification and immobilization on the sensor.
GFP11 versus GFP1-10
These are the two halves of the same fluorescent protein, but only one of them is part of your construct.GFP1-10 is a reagent, not part of your construct. It never appears in the sequence you submit or in the protein we express. Only the GFP11 fragment is on your design.
How the measurement works
1
Express
Your design is expressed with the split-GFP11 and Twin-Strep-tag construct attached.
2
Add GFP1-10
We add the GFP1-10 detection reagent in excess to the expressed material.
3
Read fluorescence
Reconstituted GFP fluorescence is read in relative fluorescence units (RFU).
4
Convert to concentration
RFU is converted to concentration using a standard curve built from known standards.
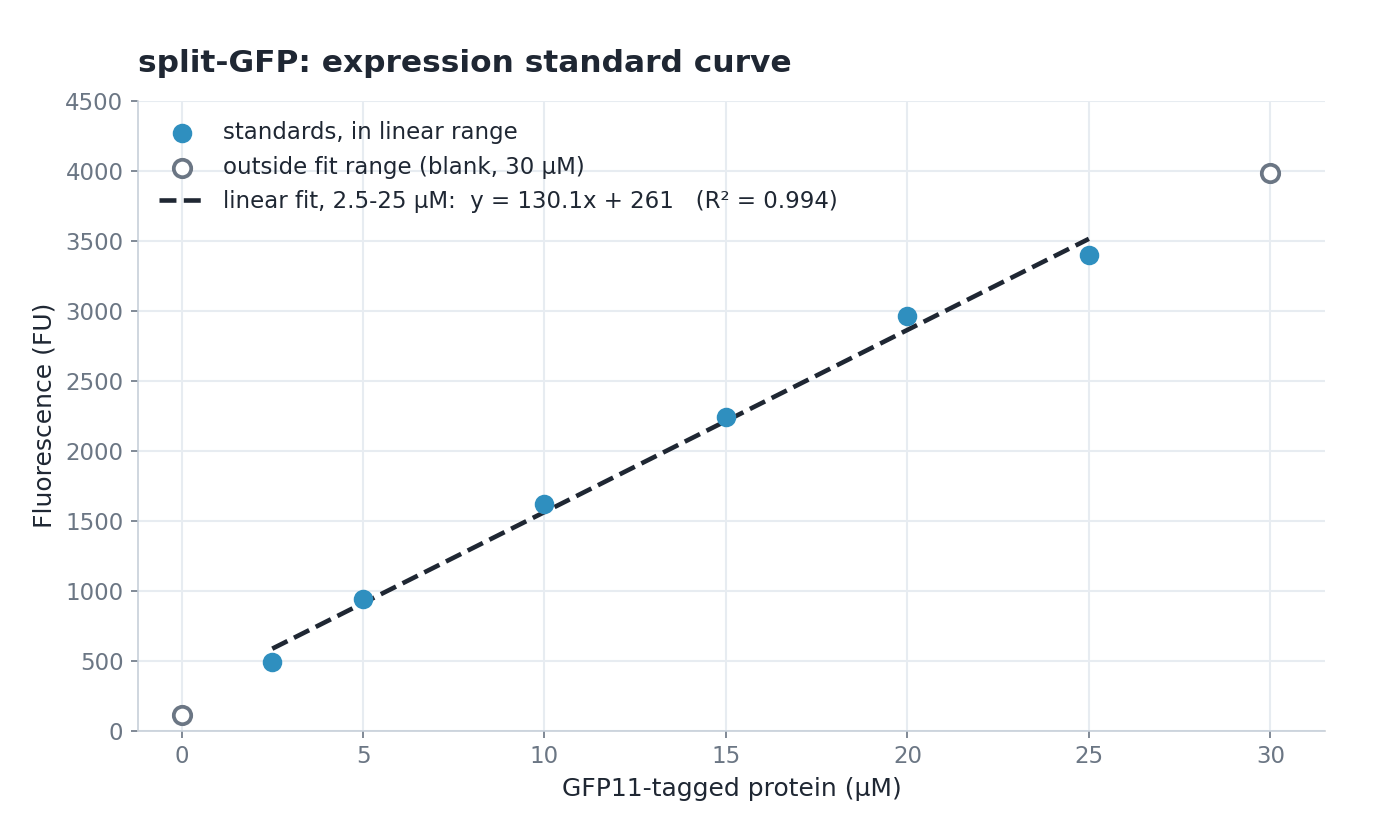
split-GFP standard curve measured on our platform. Reconstituted fluorescence scales linearly with the amount of expressed (GFP11-tagged) protein over 2.5 to 25 µM, which is what we use to quantify expression. The blank and the 30 µM point are plotted but sit outside the fitted range.
Fluorescence is the direct measurement
There are no intermediate absorbance or A280 readings behind the reported concentration. Fluorescence is read, the standard curve converts it, and that value is what appears in your results. We also do not run separate SDS-PAGE, SEC or A280 characterization on designs. Once expression is validated, designs go directly into the binding assay.Which formats carry the tag
The split-GFP tag is added to all proteins except Fabs and IgGs. Oligomeric proteins are more sensitive to tag addition, which can affect their assembly, so we leave those formats untagged. An alternative expression quantification approach for Fabs and IgGs is in development.FAQ
How were the concentrations in my results calculated?
How were the concentrations in my results calculated?
Directly from fluorescence. The GFP1-10 reagent is added after expression, reconstituted GFP fluorescence is read in RFU, and a standard curve of known standards converts that RFU value to concentration. There are no intermediate measurements between the fluorescence reading and the reported concentration: no absorbance step, no A280.
Is the split-GFP tag on my Fab or IgG?
Is the split-GFP tag on my Fab or IgG?
No. We add the split-GFP tag to all proteins except Fabs and IgGs. Oligomeric proteins are more sensitive to tag addition, which can affect their assembly, so those formats are expressed without it. An alternative approach for Fabs and IgGs is in development.
Does the tag stay on for the binding assay?
Does the tag stay on for the binding assay?
Yes. We do not cleave the tag between expression and binding, so the reported binding data is measured on the tagged protein.
Related pages
- Construct and tag design: the full tag we append, its sequence, and where it sits on your design.
- Expression: what an expression run includes and what you receive.